A Case Study by Mauricio Parada | LinkedIn
ApertureA Data-Driven Journey to Reverse Youth Churn
My Role
Product Manager
Project Type
End-to-End Conceptual Project
Timeline
4-Month Full-Time Immersion
Executive Summary
In this conceptual case study, I tackled a critical business problem for a fictional 500M MAU platform: accelerating churn in its 18-24 user segment. Starting with the general assumptions provided in the project brief, I used a data-driven process to test those beliefs, leading to a strategic pivot toward the true competitive threat. This case study focuses on the methodology that I used to then design and validate a low-effort, high-impact MVP, the "Auto-Fix Button", to address the root cause. This document details my end-to-end product thinking behind that journey.
Introduction: The Challenge
This case study documents the end-to-end product management process I applied to a project for Aperture, a fictional social platform with 500M MAU. This project represents my comprehensive application of product management methodology learned through intensive coursework over several months, a synthesis of everything I learned throughout my CareerFoundry journey.
The business challenge presented to me was to address an accelerating churn rate in Aperture's core 18-24 user segment. My task was to analyze the provided business context, diagnose the root cause of the problem, and develop a plan for a validated, launch-ready MVP.
Discovery & Strategy
Building a Solid Foundation
The Initial Situation: From a Symptom to a Problem Statement
The project began with a business symptom: "Young users are leaving." The prevailing assumption within the provided company context was that we were losing market share to the industry's largest competitor. My first task, following the course methodology, was to transform this symptom into a clear, data-supported Problem Statement before jumping to solutions.
My Process & Rationale
Why start with a formal Problem Statement? A team without a clear, shared definition of the problem will waste resources. Creating this document first provided a "North Star" for all subsequent research.
Why map stakeholders in parallel? The best data is useless without buy-in from the right people. Mapping stakeholders with a Power/Interest Matrix was a risk mitigation strategy to ensure the plan was organizationally viable from the start.
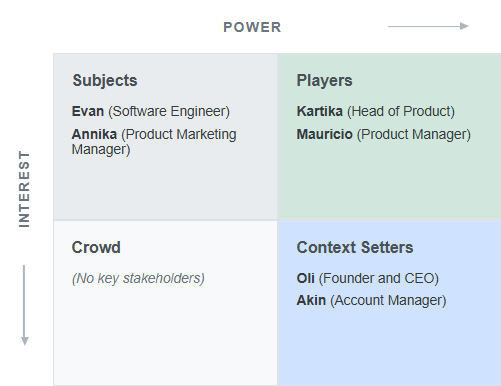
Mapping the organizational landscape with a Power/Interest Matrix was a key first step to simulate a clear communication and alignment strategy.
Key Learning from this Phase
As an engineer, my instinct is often to jump directly to the solution. This phase taught me the discipline of resisting that urge, and instead focusing first on deeply understanding and defining the problem. It's about ensuring the entire organization is aligned on solving the right problem before any work on the solution begins.
Research & Insight
Challenging Assumptions with Data
The Initial Situation: An Unvalidated Hypothesis
At the end of Phase 1, I had a clear, data-supported Problem Statement. However, it was still based on my own critical, unvalidated hypothesis: that the main competitor was the market leader. My next task was to use the provided data to test this hypothesis, which led to the core strategic pivot of this entire project.
Revisiting the Hypothesis: A Necessary Pivot
My initial hypothesis centered on the market leader. However, a direct comparative analysis of the provided data revealed a much stronger correlation between our churn and the growth of an emerging innovator, Competitor B. At this point, continuing with the original assumption would have been irresponsible. The evidence demanded a strategic pivot, regardless of the work already done.
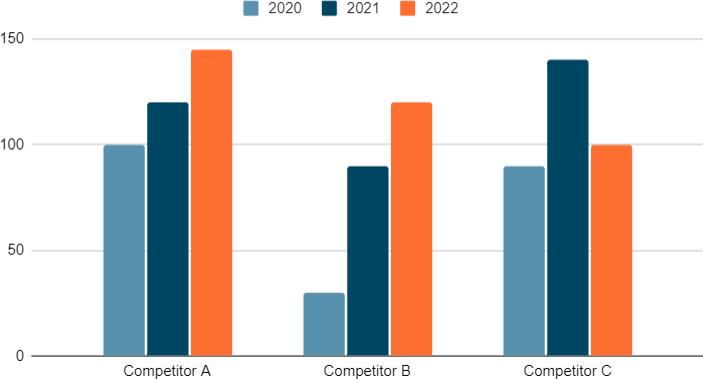
This chart shows the strong correlation between our churn and Competitor B's growth, the key data point that triggered the strategic pivot.
Why articulate with a Persona and Journey Map? Charts show what is happening, but these tools show why. I chose these artifacts to build empathy and make the problem tangible. The Journey Map was especially critical, it visualized the precise "moment of failure," turning the abstract concept of "churn" into an actionable problem that an entire organization could rally behind.
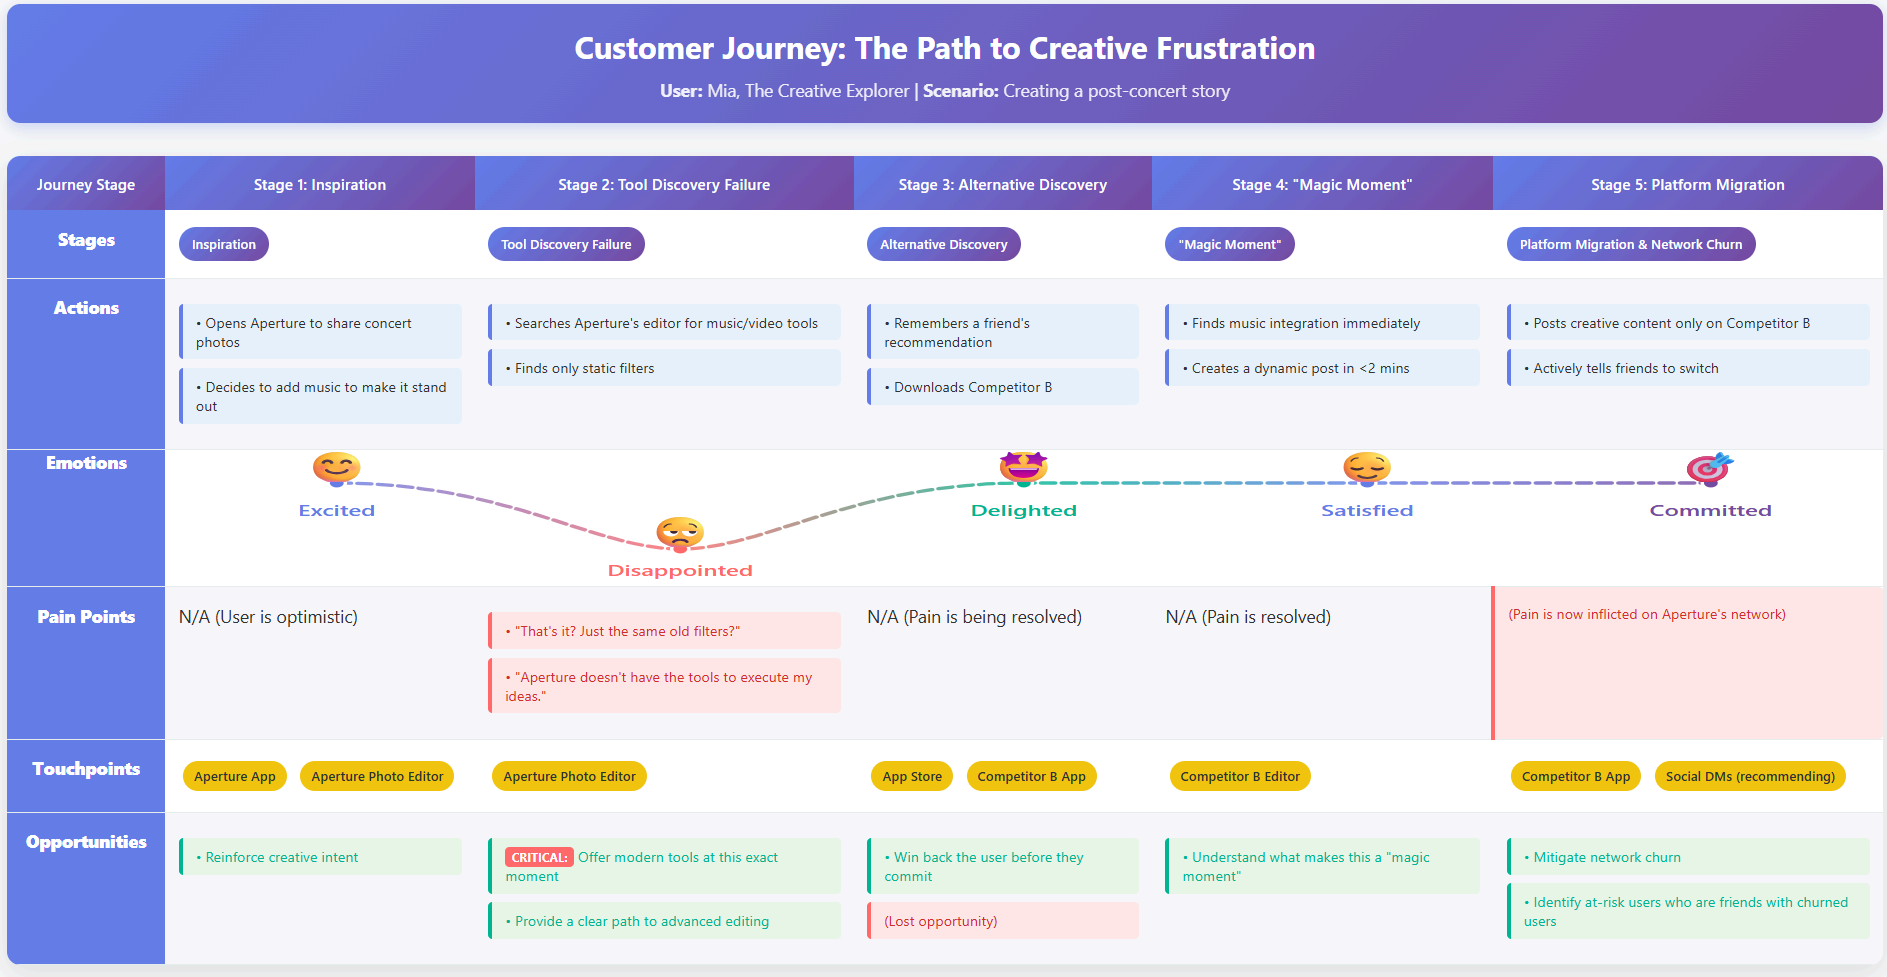
The User Journey Map was the key artifact that visualized the precise "moment of failure," making the need for the pivot undeniable.
Key Learning from this Phase
The key learning here was to trust the data over the initial hypothesis. This phase taught me that a PM's most important job is to challenge assumptions, even those from leadership, with clear evidence, and to build a compelling narrative that allows the entire organization to align around the real user problem.
Solution Design & Validation
From Insight to a De-Risked MVP
The Initial Situation
At the end of Phase 2, I had a powerful, human-centric insight: the user "Mia" was leaving because Aperture's tools felt "basic" and failed to empower her creativity, especially compared to the "one-tap magic" offered by Competitor B. The challenge now was to translate this insight into a tangible, high-impact solution without falling into the trap of just copying the competition. This phase documents the process I would lead a future team through.
Why a multi-step ideation process and an Impact vs. Effort Matrix? The structured ideation (HMWs, Brainwriting) ensures creative energy is focused on the right user problem. Then, since resources are always finite, the Impact vs. Effort Matrix provides a defensible way to prioritize, forcing a strategic trade-off discussion.
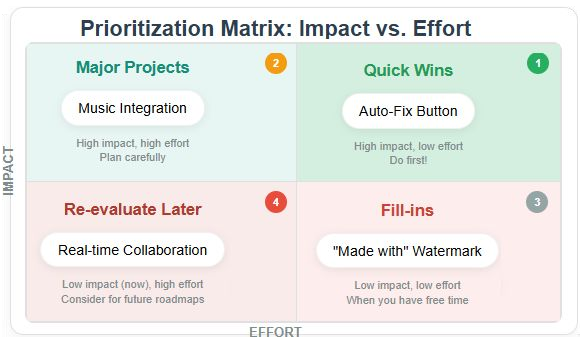
Using a clear Impact vs. Effort Matrix allowed me to identify the 'Auto-Fix Button' as the highest-value, lowest-effort first move.
Why a Lo-Fi HTML Prototype? For a feature centered on "feel," static mockups are insufficient. I needed to test the experience. An interactive prototype allowed me to validate the core usability before a single line of production code was written, de-risking the entire concept.
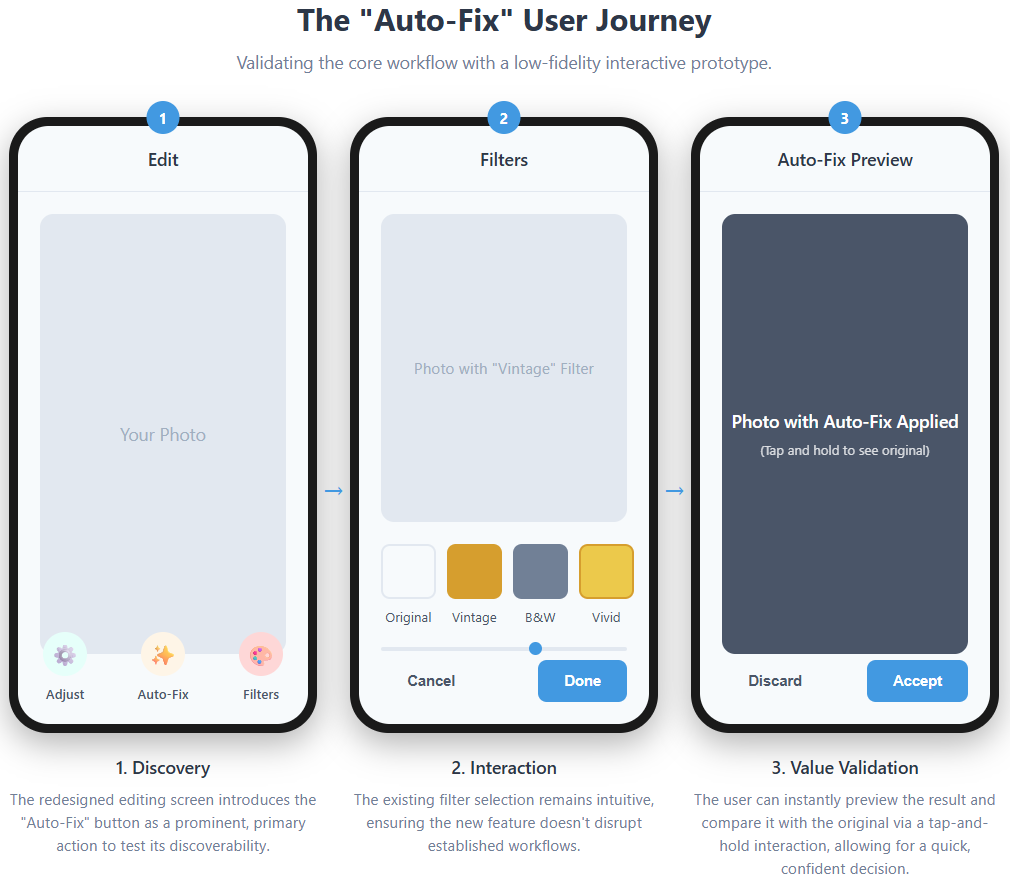
A simple, interactive prototype was used to validate the core workflow and usability, de-risking the concept before committing to development.
Key Learning from this Phase
The key learning was the power of rapid validation. The discipline I learned and applied here was to create and test even a simple interactive prototype first. This phase reinforced that de-risking assumptions through cheap, fast experiments is the highest ROI activity a PM can do.
Launch Preparation & Measurement
From MVP to a Go-to-Market Plan
The Initial Situation
At the end of Phase 3, I had a validated MVP concept. The next challenge was to translate this into a comprehensive, launch-ready plan.
My Process: Defining Success & Planning Execution
To ensure a successful launch, the first step was to define what success looks like with absolute clarity. I structured the success metrics using the AARRR metrics framework, which provided a clear funnel and allowed me to identify a single OMTM (One Metric That Matters) to provide ultimate focus for the initiative.
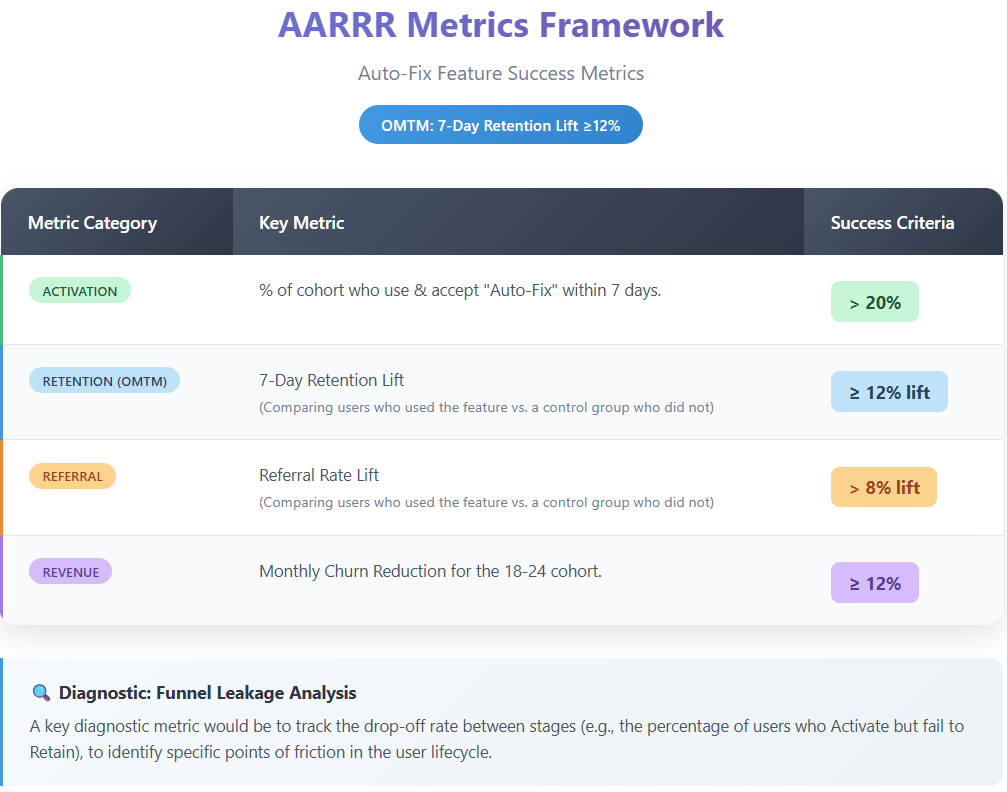
The AARRR metrics framework with a single OMTM (7-Day Retention Lift) provided an unambiguous definition of success.
With the success metrics defined, the next step was to create a Go-to-Market plan that prioritized learning while minimizing risk. I designed a controlled, phased rollout strategy, visualized in the <strong>Gantt Chart</strong> below.
Why choose a controlled rollout instead of a full launch? The primary goal of this MVP was learning, not immediate scale. A full launch to 100% of users would maximize exposure but also the "blast radius" (the scope of a potential failure). A gradual rollout allows a team to measure the feature's real impact with reliable data, minimizing damage to the user base and allowing for quick adjustments.
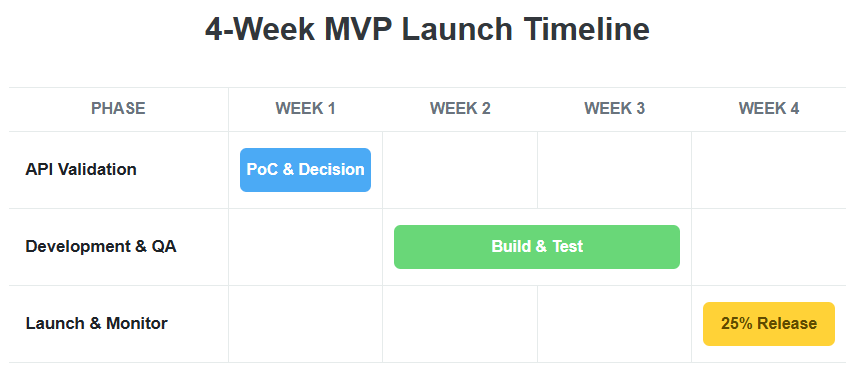
The Gantt Chart visualizes the 4-week controlled rollout, designed to maximize learning while minimizing risk.
Key Learning from this Phase
The key learning was how to think probabilistically and plan for failure. The real work of a PM is to anticipate the different ways a launch can go wrong and to have a pre-defined, data-driven plan for each scenario. Creating the "kill switch" criteria was a crucial exercise in strategic discipline.